
Managing ITER’s progress
Key performance indicators, estimate-to-complete updates, and milestone trend analysis are part of a basket of schedule and cost control measures that the ITER Organization tracks monthly and reports to the ITER Council.

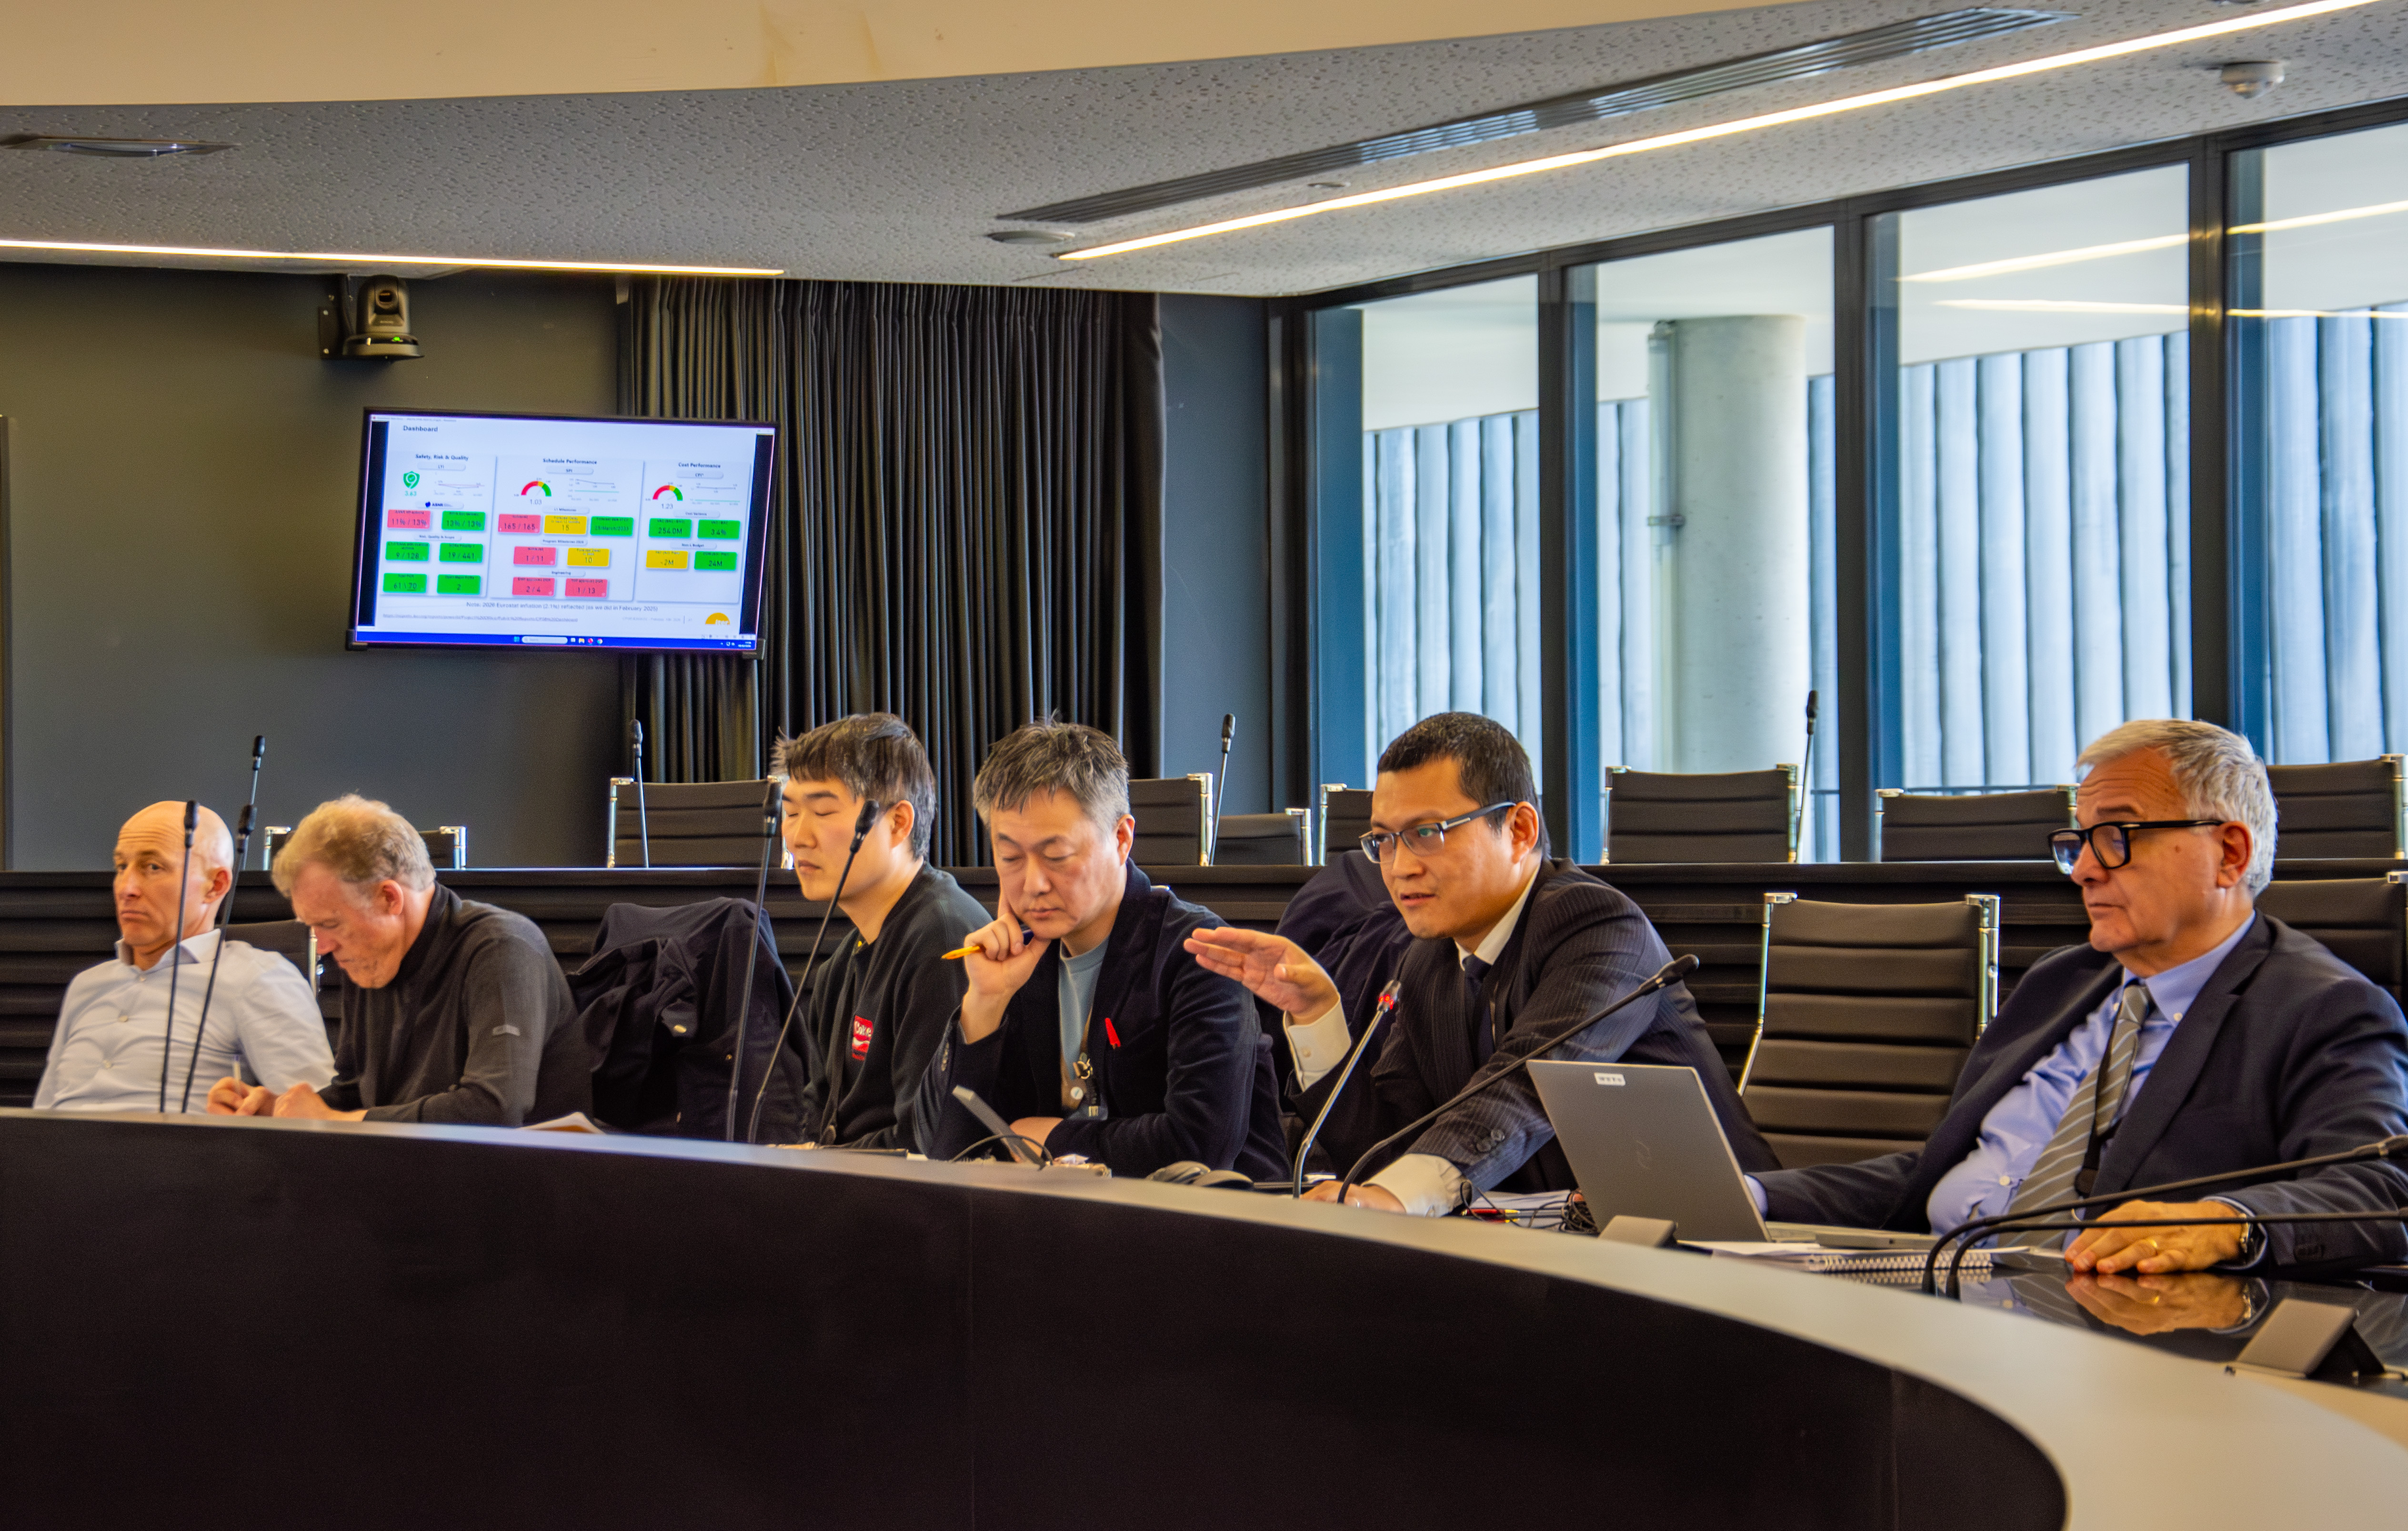
Managing a project as large and complex as ITER requires more than tracking deadlines and budgets. Every month, the ITER Organization must determine whether thousands of activities—from design and manufacturing to component installation, commissioning, and operation—are progressing fast enough to keep the project on track.
A delay of just a few weeks on critical-path activities can ripple through multiple construction programs. To spot such issues early, ITER managers monitor 21 performance indicators through a Construction Project Steering Board dashboard (launched in 2026), tracking everything from potential schedule slippage and cost efficiency to safety performance and risk mitigation.
The new project performance management system was introduced alongside ITER's 2024 baseline, giving managers a more detailed and consistent view of progress than was previously available.
Taka Omae, the Deputy Head of the ITER Construction Project and Head of Construction Project Office, oversees the construction project performance tracking system at ITER. “With the introduction of the new baseline, we have improved our ability to measure progress. We have more in-depth capability to monitor activities at a detailed level per construction project, and we do it in a more frequent manner. We measure once per month and report transparently to our stakeholders.”
ITER uses earned value management, a project management methodology that assigns a planned value to construction activities like installing components or lifting a sector, then tracks how much of that work is actually completed (“earned value”) at the actual cost. By comparing these numbers and tracking performance indices, managers can quickly see if the project is ahead or behind schedule, or under or over budget.
Think of it as a progress “health check” for the project.
A schedule performance index (SPI) of 1.00 or higher means the project is realizing the value on time—or ahead of schedule—compared to baseline plans. A cost performance index (CPI) of 1.00 or higher shows that spending is in line with—or below—the projected budget for planned work in the baseline.
Since the start of tracking against the ITER baseline in January 2024, the Construction Project’s schedule and cost performance indices have remained well above 1.0. By the end of June 2026, metrics show that 192 Level 1 schedule milestones have been achieved against 188 milestones planned for the same period.
“The numbers are good and this is important, but the even bigger achievement is the reinforced capability at ITER to measure our progress,” says Taka Omae. “These are genuinely data-driven metrics, providing a clear picture of where we are. The numbers themselves aren’t the goal, they just help project managers at ITER know how they are doing in terms of meeting their objectives per area.”
Like any health check, the indicators are most valuable not when everything is going well, but when they reveal problems early enough to be addressed. As ITER advances through increasingly complex phases of assembly and installation, the ability to measure progress accurately may prove just as important as the progress itself.